Kubernetes has become the defacto standard for Container orchestration when deploying large-scale applications. It provides an easy abstraction for efficiently managing large-scale containerized applications with declarative configurations, an easy deployment mechanism, observability, security, and both scaling and failover capabilities. As with any type of application, collecting and analyzing logs is crucial when observing the applications, to make sure the applications are running smoothly. Given K8S is a platform that can run hundreds of Pods at a given time, having a centralized Logging mechanism enhances the developer experience which allows them to easily monitor the logs.
The common standard way to push your container logs into a centralized logging mechanism is by using a Sidecar container within your pod. But in case, if you want to avoid using a sidecar and if you need to push the logs to a third-party log analyser you can get an idea of how to do it by reading this post. In this post, I will explore how you can leverage daemon sets to push specific container logs to a log analysing system. In order to set things up, I will be using Newrelic and Fluent-Bit to get this done. And as the application, I will be using WSO2 MI, but you can run any application.
Why Not a Side-Car.
As I mentioned earlier the side-car is the standard way to push logs from your application container. But the side car can consume resources since it will spin-up a dedicated container to read the log files per application container. So the resource consumption can be high since the number of logging containers will be equal to number of application containers. Hence instead of a side-car we can use a Daemonset which will only create a Daemon process per K8S minion node. The main problem with a common Daemonset for all the pods is how one can differentiate, filter and group logs as required. We will talk about this as well in this post.
How Kubernetes Logging Works
The standard way for an application to log, is to push the application logs in to the standard out(std-out). What ever that is written to the std-out will be shown by the kubectl logs command. All the logs that are generated from the containers(all the std-out streams generated from all the containers) will be written to files in the minion(worker) node where the pod is running. By default these logs get written in to “/var/log” directory.
The pod related logs will be stored in /var/log/pods/ and the content of this directory will look like following.
![]()
As shown in the above image the pods directory have sub directory to represent each pod. The structure within the log directory doesn’t have a folder hierarchy to represent different namespaces, deployments etc. But simply follows a naming convention to differentiate the logs. Also in-order to make the automation process of reading these logs easy, the container log files are sym-linked to files in /var/log/containers. The contents in /var/log/containers are depicted in the below image.
![]()
As shown above, the log files in the /var/log/containers directory are sym-linked with the actual log files available in the /var/log/pods directory. If we look closely at the log file we can see a naming convention again. Understanding this naming convention is important when filtering the relevant log files which needs to be pushed to the log analyzer. The file naming format is similar to below.
**__-\*.log**
Filtering the Logs
In order to filter out the logs we can use naming conventions and regex patterns. Fluent-bit allows you to pick log files based on a regex pattern. As mentioned earlier the log file pattern is something similar to below, hence this pattern can be used when filtering the logs.
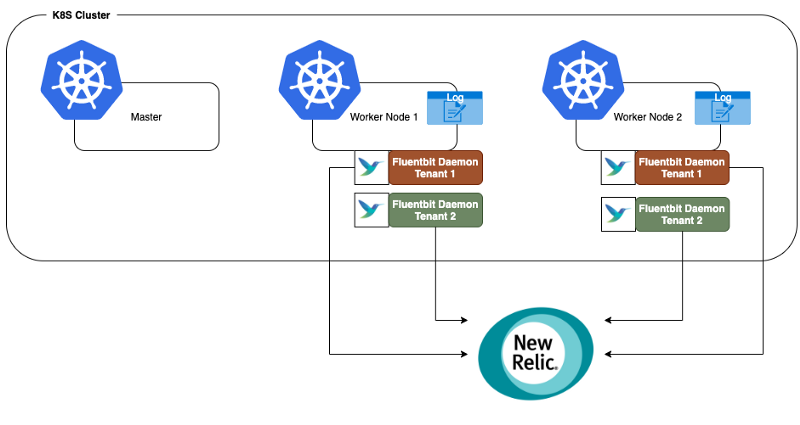
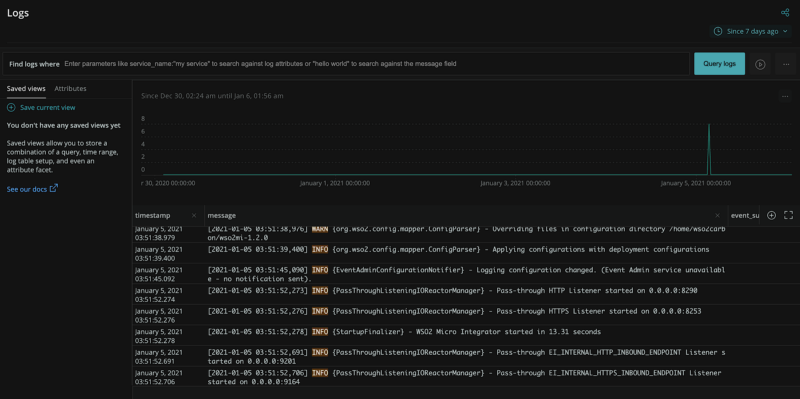
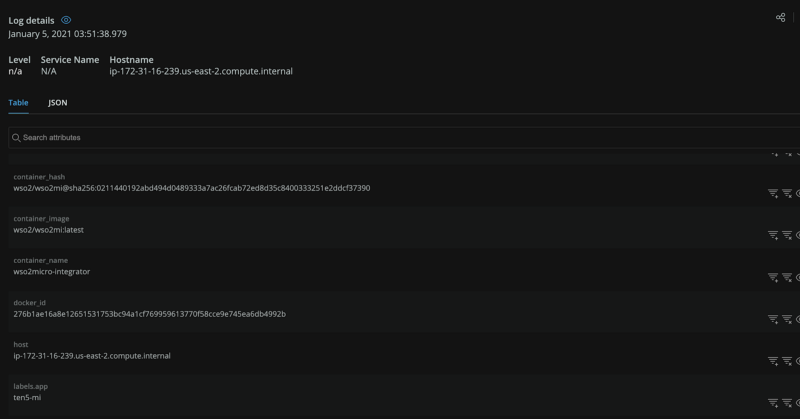
__-\*.log If you want to select all the logs in a specific namespace you can use a regex pattern similar to below. __\*.log If you want to select specific pods in a specific namespace, first you have to come up with a naming convention for your containers. For example you can add a known prefix/postfix for the name of your container, so if we name out application container as “wso2mi-integration" wso2mi is the prefix we will be using to filter the logs. The regex to filterout containers in a specific namespace with the prefix wso2mi will look something similar to below. \*__wso2mi-\*.log ### Building the Solution #### Components In order to demonstrate the solution I will be using two technology stacks. As the application Stack I will be using [WSO2 Micro Integrator](https://ei.docs.wso2.com/en/7.2.0/micro-integrator/overview/introduction/) and as the log analysing platform I will be using [Newrelic](https://newrelic.com/) which is a cloud hosted platform. #### Use-case Before building the use-case let’s try to understand what are we going to build. In this use case we will have multiple WSO2 Micro Integrator Pods running in different namespaces. We will be pushing the MI logs in each name space to a different account(Space) in Newrelic. #### Architecture The solution at a very highlevel can be captured as shown in the below image.  As shown above for each filter criteria(e.g: Per name space, Per container group etc.) we will be running a daemon set. These Daemonsets are responsible to reading the relevant logs and pushing them to the correct Newrelic account. #### Setting up the Components **Deploying the application** In order to deploy the application to K8S environment I will be using helm charts provided by WSO2. 1. First I will create a new K8S namespace to deploy the application. ```sh kubectl create namespace test-tenant ``` 2. Then clone the helm chart repository and checkout the correct tag. git clone [https://github.com/wso2/kubernetes-mi.git](https://github.com/wso2/kubernetes-mi.git) ```sh cd kubernetes-mi git checkout tags/v1.2.0.1 ``` 3. Then navigate to helm/micro-integrator directory and issue helm install command. ```sh helm install wso2-mi . -n test-tenant ``` 4. Now you can check whether MI is deployed by browsing the resources. ```sh > kubectl get all -n test-tenant ```  #### **Installing the Daemonset** Newrelic has a Fluent-bit based plugin to read and push logs. Lets install the plugina and start pushing logs. #### Installing the Fluent-Bit output adapter We will be installing the Newrelic’s Fluent Bit output plugin as a daemonset as illustrated above. For each tenant space we will be creating a new daemonset. Follow the instructions below install the daemonset. **Step 01** * Clone the following helm repository. ```sh git clone [https://github.com/newrelic/helm-charts](https://github.com/newrelic/helm-charts).git ``` **Step 02** * In the cloned repository, navigate to helm-charts/charts/newrelic-logging/ and open the values.yaml file * In the values.yaml file add the license key of the Newrelic account as shown below. (You can generate a license key from your newrelic account)  * In the same file specify the relevant regex pattern to filter-out the correct log files. Note the naming convention of the log files when creating the pattern. __-\*.log A sample log pattern is \*__\*.log  **Step 03** * Now install the helm chart. Note that I will be installing the Daemonset to the default namespace. ```sh helm install tenant01-logger . ``` * You can check the created resources as shown below. The ready count should match with the number minion nodes you have in your K8S cluster.  #### Checking the logs in Newrelic Inorder to check the application logs you needs to login to the Newrelic Dashboard and logs will be available in the logs section.  In Newrelic the logs can be filtered based on different attributes etc. To check what are the log related attributes you can click on a log entry.  Happy Coding!!! 

